Using Free Software BI tools to build a modern analytics platform.
Akhil Reddy Patolla
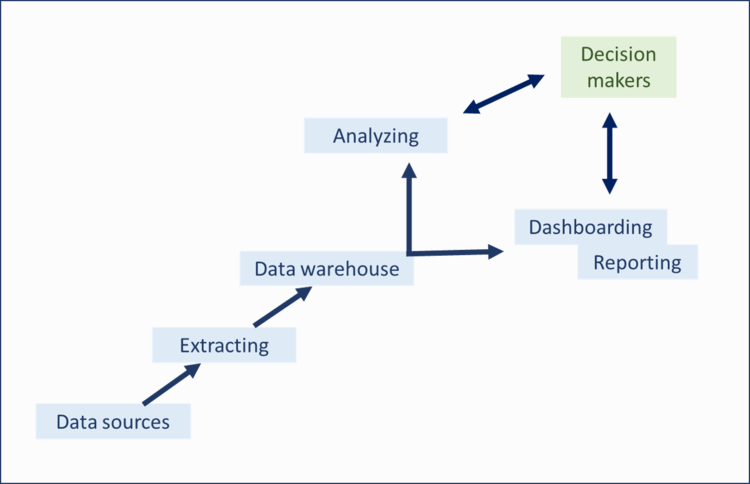
Business Intelligence, often called BI, is the process of exploring precious insights or trending in data to make more efficient decisions in the business/organization.
Primary component to implementing a BI solution is the raw data. This data can be anything like sales data, log level data, advertising portfolio etc. Then a data warehouse is the logistics platform that connects to all the different operational databases withholding the above-mentioned raw data and allows use to create relationship between them. Once all the data is connected and communicating to each other in different data models, it is time to analyze it and extract actionable insights. This step often blends well when a BI tool is overlayed on top of this because of the ability to present the tabulated data in a pictorial format. This interactive dashboard enables us to perform business decisions and the ability to track, monitor and report on our data.
How are BI tools applicable in a real-world use case?
BI tools are correct example of the “80-20 Principle”. In an organization/business 80% of your results come from 20% of your actions/platforms. Implementation of a BI can enable and guide one to decrease the amount of time it takes to do a sale, identify customers purchase behavior, planning successful marketing strategies, Improve operations etc.
Using BI tools to build modern analytics Platform.
Problems in Solutioning a modern Platform
A human mind holds more data through examples and visuals when contrasted with perusing or considering numbered documents. In the business world, perception is basic in understanding the importance of information. Let us comprehend with a model.
An online business organization gets a huge number of requests every day. For considering the week by week execution, a graphical plot demonstrating the quantity of requests every day will bring about quicker understanding than a bookkeeping page including the request subtleties.
Subsequently, visual information portrayal is a ground-breaking strategy. It helps organizations in dissecting patterns and increasing important experiences which further aides in dynamic.
Open-source Business Information platform like Redash, Metabase, and Apache Superset are picking up fame as the expectation to learn and adapt is not steep for non-specialized clients. Countless new businesses are utilizing Metabase, Redash, and Superset to question, work together, and envision.
In the above scenario maintaining an open source BI also enable the organization to make better decisions which will help the organization to grow.
Powering BI requirements
- Democratize Analytics and Enable Self-Serve
- Ease of Use and Low Learning Curve
- Speed and Connectivity to Varied Databases
- Build a Modern Client Facing Platform
- Provide Actionable Insights on Platform
- Decrease Development Time
- Maintain Metrics Integrity and Reduce Copies
Platform Development Requirements
- Ability and Ease of Embedding – A BI tool should be able to export the charts that are created via iframe or JavaScript rendering
- Flexibility in Embedding Dashboards / Charts –
- Ability to Appear Native – User Experience should be as seamless as possible.
- Cross Chart Interaction –
- Ability to Pass Filters to Preload Data –
- Chart Customization –
How to select a BI Tool? (Tool selection methodology)
BI tools must be chosen based on final desired design / goal of the platform. Here are few examples of the features that you might need to look to select a BI tool for your use case. Keep in mind that they might vary based on your end goal / platform.
- Mobile Friendly – Charts should be responsive when embedded and viewable on a mobile device.
- Easy Chart Building – level of complexity to build and develop charts.
- Cross Chart Interaction – charts ability to Interact with the users actions.
- Coolness Factor – This is purely a UI / UX choice.
- Connection to Live DBs – Tools ability to connect to multiple databases such as mysql, postgres, druid, mongo etc.


- Embedding – Ability / options to embed the charts on a Web Platform.
- Speed – Loading time for a chart when embedded.
- Stability – How stable are the charts when embedded. One must be cautious of any Error message that is being displayed from the Embedded chart.
Solutioning the Analytics Platform
- Embed Charts with Parameterized Filters -
- OAuth 2.0 Authentication
- Angular 8 / REACT + NODE (Tech Stack)
Solutioning Open-Source BI tools In Contrast to other Enterprise tools:
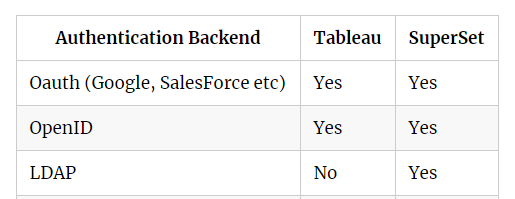
Domain of data & business intelligence have emerged rapidly for the past few years and this unfold a new chapter of enterprise and open source alternatives. For an example Tableau is an Enterprise BI tool and Superset is an excellent alternative to it. Here is an one to one comparison of the tools features and pricing.
Authentication is an important element for reception of BI dashboard into an endeavor. Here is an outline of upheld verification backends.

Pricing might vary based on multiple factors, but according to multiple source the below mentioned is an average quote.
Superset – FREE
Tableau Desktop - $35 per user per month (billed annually)
Tableau Desktop Professional - $70 per user per month (billed annually)
Tableau Server - $35 per user per month (billed annually)
Tableau Online (hosted server) - $42 per user per month (billed annually)
Conclusion
- Model Data in Warehouse before Ingesting/Presenting in a BI tool is the key to be able to have a successful and smooth presentation.
- Design & Speed is Bound by the Embed Strategy
- Choosing right BI tool with required Embed strategies is the Key
- One can Leverage a BI Tool to Release Analytics Platform in Record Time as well as maintain.
- Embedding is Powerful and Easy to Use
(Akhil has been associated to Swecha since 2012, currently working with Madison Logic for more than 2 years, and dons both a Big Data engineering and Data Science role. Prior to Madison logic, Akhil was working as a researcher at US department of Energy: Argonne National Laboratory. He graduated with a Masters in Data Science from Northern Illinois University. His expertise are in NLP, game designing, and building analytical platforms. Akhil has developed analytical packages for the MIRA supercomputer.)